
EXECUTIVE SUMMARY
At more than 200 days with an expiry currently set for mid-November, the 2026 Jones Act waiver is the longest continuous waiver in the act’s history. To determine if the waiver voyages are creating new links between U.S. ports or states, Balsa compared the routes of 296 waiver voyages reported to MARAD by October 5, 2026 against the routine movements of 56 Jones Act-eligible tankers and 96 articulated tug barges (ATBs).
At the port-to-port level, 128 of the 178 unique waiver routes (72%) were not traveled by Jones Act tankers or ATBs. At the state-to-state level, however, only 11 of 50 waiver connections (22%) were unique to waiver vessels. Most waiver voyages ran between states the domestic tanker and ATB fleet already served.
However, the domestic Jones Act tankers and ATBs were consistently occupied with their own contracted voyages and, as demonstrated by previous research, were not available to carry waiver cargo. This indicates that the current Jones Act fleet is not sufficiently meeting demand in these regions. Waiver vessels have also strengthened connections the domestic fleet serves only thinly, notably between Puerto Rico and the mainland, and between the Gulf and the West Coast.
OVERVIEW
At over 200 days, the 2026 Jones Act waiver is the longest continuous waiver in history. Having been extended twice, it is currently set to expire in mid-November 2026. As of October 5, a total of 296 waiver voyages have been reported by the U.S. Department of Transportation’s Maritime Administration (MARAD) for the entire waiver period, along with at least twelve unreported waiver trips independently documented since July.
Critics of the waiver consistently point to its negative impact on the U.S. maritime industry, and there has been considerable debate regarding whether or not the waiver vessels granted access to the U.S. coastline are meeting a demand unmet by the current Jones Act fleet. Previously, Balsa has demonstrated that the Jones Act tankers, which are made up of independently powered vessels of 1,000 gross tons or greater, largely follow consistent movement patterns. Alongside the Jones Act tankers, Balsa also began data collection on articulated tug barges (ATBs) to fill the data gap in analysis on the impacts of the waiver on U.S. vessels, as ATBs make up a significant portion of waterway transport in the United States.
METHODS
Jones Act-eligible tankers were identified from MARAD’s list of U.S. Flagged Vessels from March 2026. The list is made up of self-propelled, privately owned U.S.-flag vessels of 1,000 gross tons and above, and marked vessels as “Jones Act-eligible”. This analysis tracked the movement of the 56 Jones Act-eligible tankers and excluded general cargo vessels as the waiver has been limited to energy products. All tankers were then tracked in VesselFinder.
Four months into the waiver period, Balsa began data collection on ATBs to fill the data gap in analysis on the impacts of the waiver on U.S. vessels, as ATBs make up a significant portion of waterway transport in the United States. Recent criticism of Jones Act waiver analyses has highlighted that ATBs are ignored, despite their importance to coastwise trade. Accordingly, Balsa identified a list of ATBs from the following sources:
MARAD’s 2015 list of U.S.-Flag Integrated and Articulated Tug-Barge Units (ITB/ATB). This list also includes the barge(s)* usually paired with a tug.
Crowley’s published fleet list of 17 ATB tugs across its 550, 650 and 750-series classes. Each tug’s IMO number was checked against the numbering of the rest of its class. Crowley also lists barges.
Operator fleet lists. For example, Reinauer and Moran ATB tugs came from those operators’ own fleet pages. For Reinauer, ATB tugs were told apart from its conventional tugs by horsepower, following the company’s own description of its fleet as 2,000–3,000 HP conventional tugs and ATB units of up to 7,200 HP.
This amounted to a total of 123 vessels. These vessels were then tracked in VesselFinder, and those that visited an oil terminal two or more times were included in this analysis, bringing the number of ATB tugs to 96.
The routes routinely followed by the 56 Jones Act tankers and 96 ATBs (See vessel list here) were compared to the routes reported by waiver vessels. The waiver record begins earlier than either fleet record, but the data collection periods for both the Jones Act tanker and ATB datasets overlap significantly with the waiver dates. Because both fleets follow consistent, recurring routes, the shorter records still capture the routine movements of the domestic fleet, so the difference in date coverage does not affect the comparison.
Region connections were analyzed for all Jones Act fleet, ATB, and waiver vessel activities. The directionality of port-to-port and state-to-state (or territory) were factored into the analysis (e.g. Texas to Florida and Florida to Texas would count as two unique routes). International voyages were not included in this analysis.
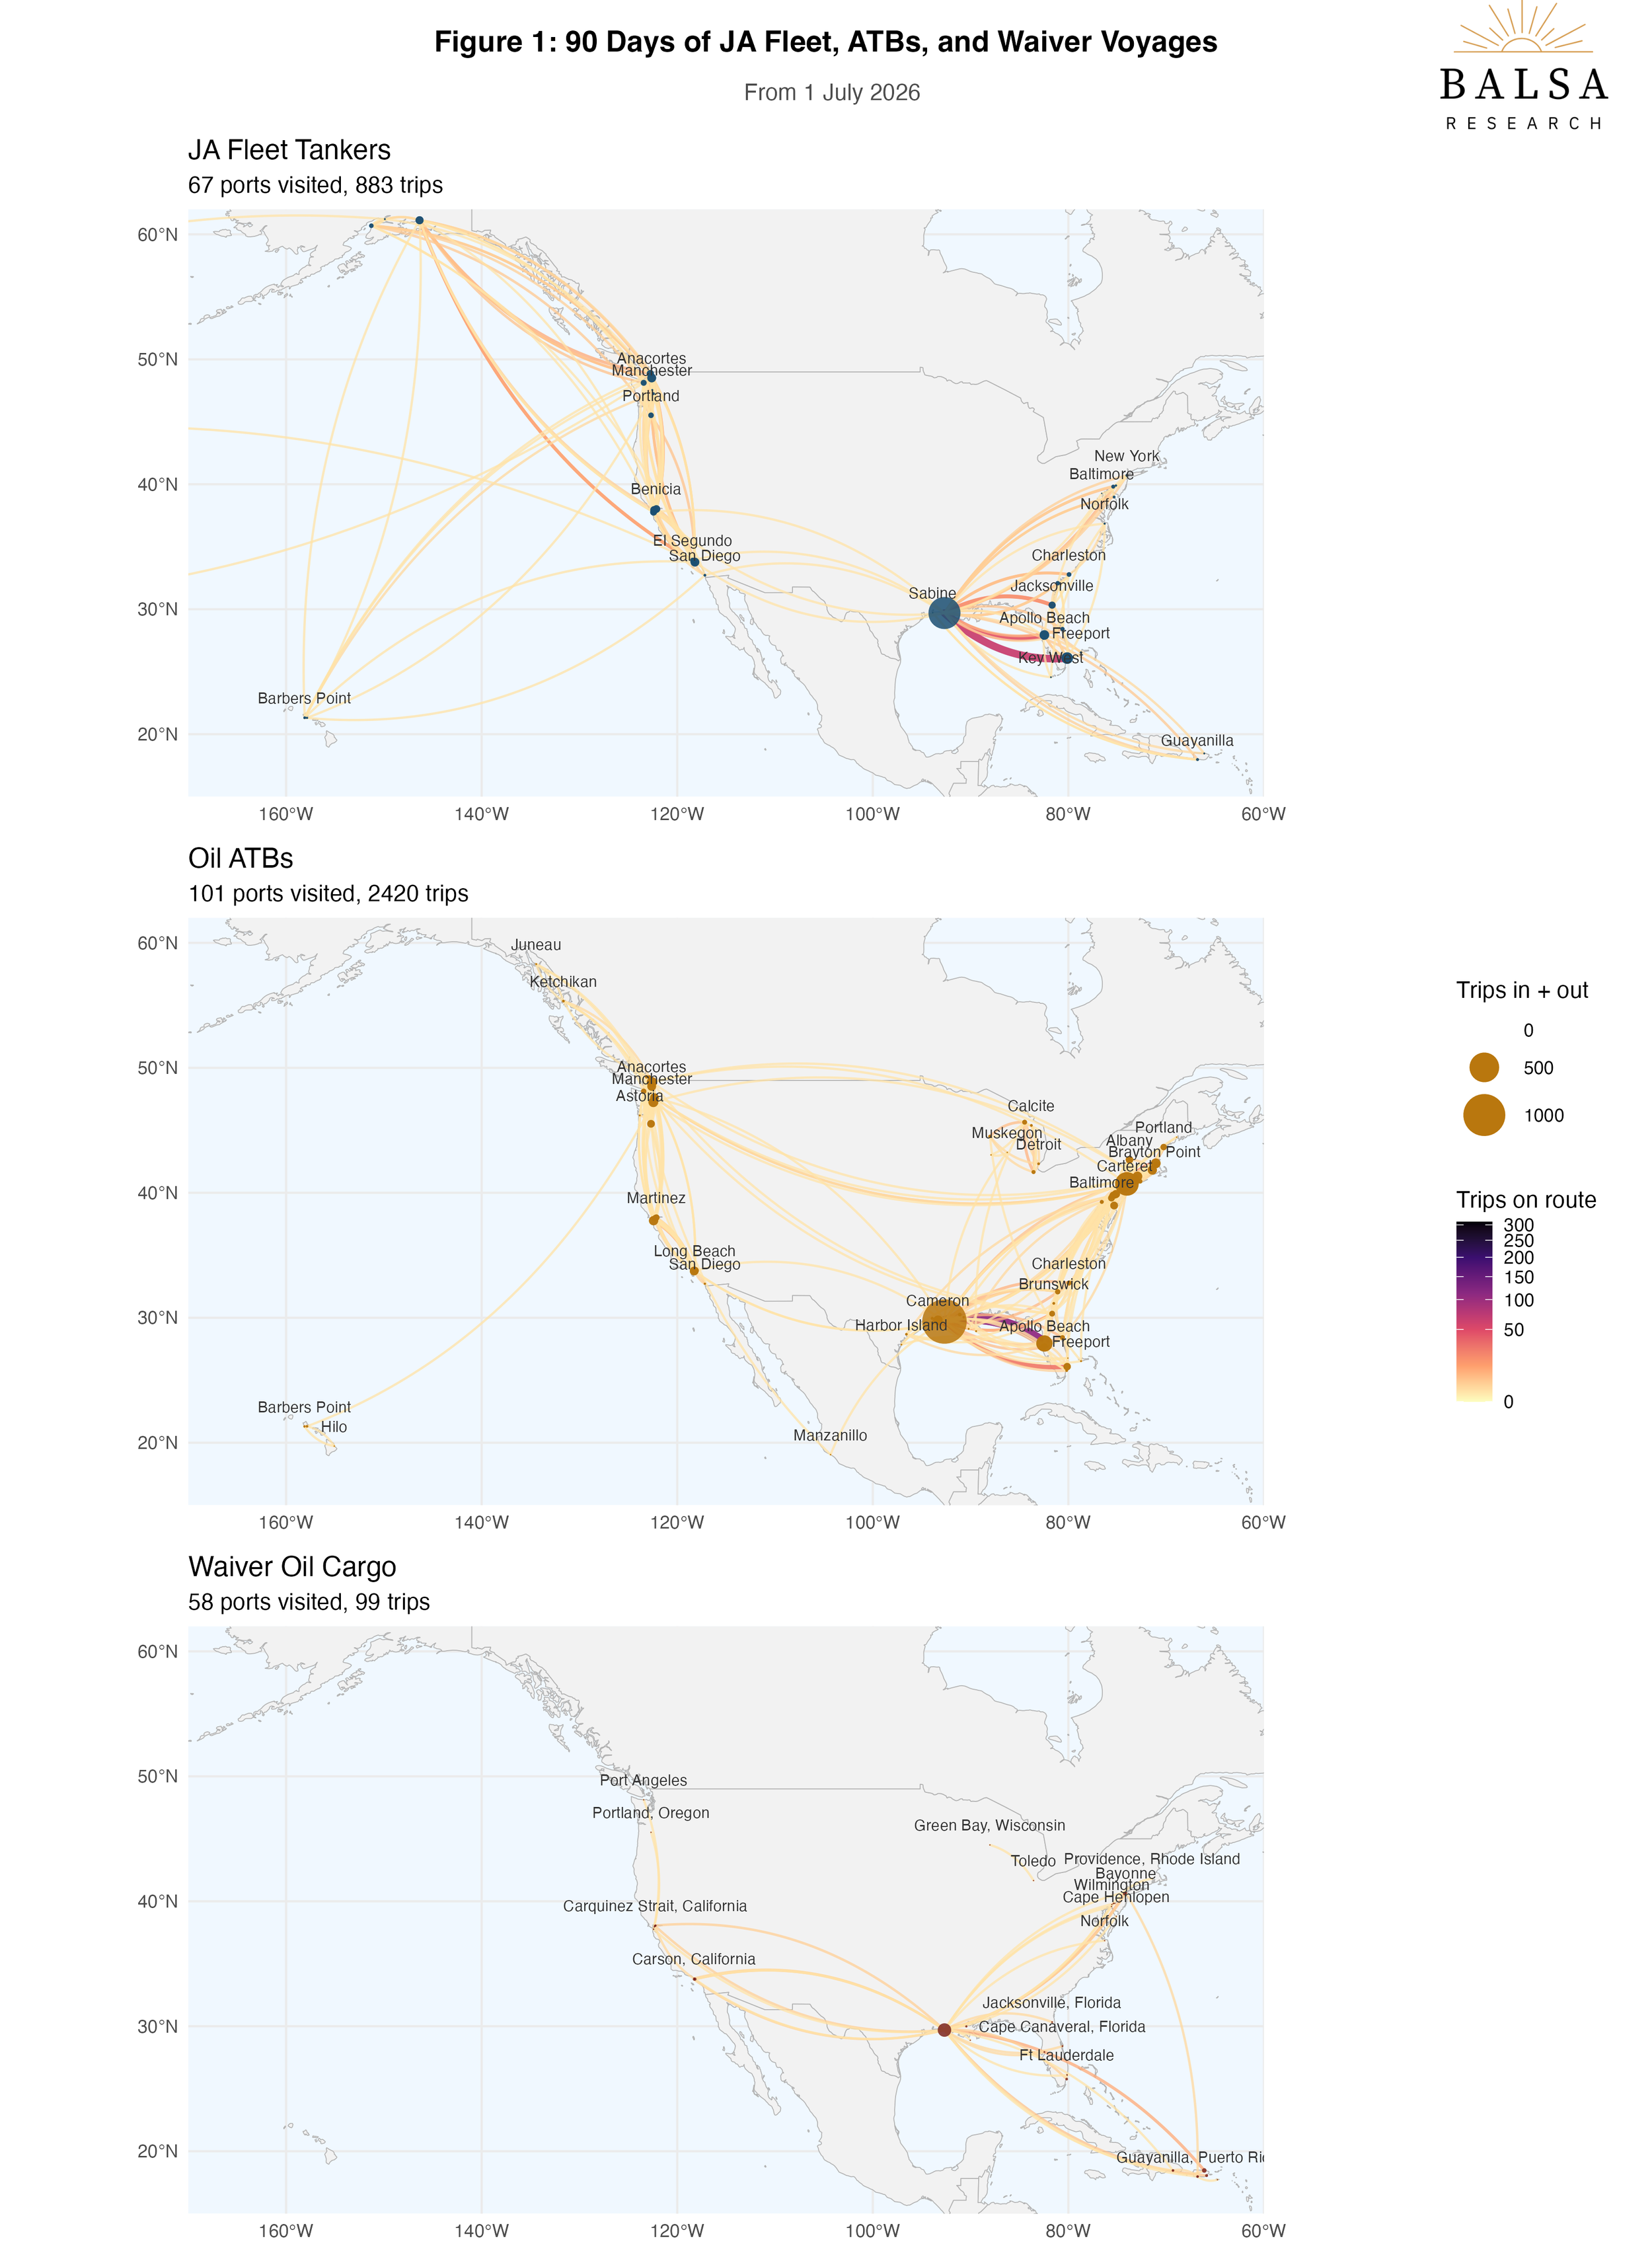
Region connections were also mapped for July through September 2026, comparing the Jones Act tankers, ATB, and waiver vessels, as this is when Balsa has data for all three vessel groups.**
*Barges cannot be tracked separately with AIS data, as they are not self-propelled, but tugboats are regularly paired with the same barge or set of barges.
** It should be noted that there has been a slight shift in waiver vessel voyages in recent months and these are not captured in the map.
RESULTS
Out of 296 waiver reports, a total of 178 unique port-to-port routes were completed by the waiver vessels, and 128 (72%) of these trips were on routes not traveled by Jones Act tankers or ATBs (Table 1). When comparing state-to-state (or territory) routes, the waiver vessels completed 50 routes, with 11 (22%) being state-to-state (or territory) connections unique to the waiver vessels (e.g. transporting goods from New Jersey to Puerto Rico). However, the vast majority of waiver voyages were state-to-state connections that were also completed by Jones Act tankers and/or ATBs (Figure 1).
| Port-to-Port Routes | State-to-State (or territory) Routes | |
|---|---|---|
| Routes Completed By Waiver Vessels | 178 | 50 |
| Routes Completed By JA Fleet | 50 | 39 |
| Percentage Of Routes Completed By JA Fleet | 28% | 78% |
The majority of waiver vessels connected Gulf states (e.g. Texas) to either the West Coast or further up the East Coast (New Jersey). A substantial number of waiver voyages also connected Puerto Rico to Gulf states (Table 2). In contrast, the majority of the Jones Act tankers and ATBs connected Florida to the Gulf Coast or connected West Coast states to each other (e.g. Alaska to Washington; Table 3).
| State of Loading | State of Unloading | Number of Waiver Trips* | Number of Waiver Vessels | Does JA Tanker/ATB Complete this Route? |
|---|---|---|---|---|
| TX | CA | 40 | 38 | Yes |
| TX | NJ | 22 | 20 | Yes |
| TX | TX | 22 | 20 | Yes |
| TX | PR | 21 | 21 | Yes |
| CA | CA | 19 | 11 | Yes |
| LA | CA | 19 | 18 | Yes |
| LA | PR | 15 | 15 | Yes |
| TX | LA | 15 | 12 | Yes |
| TX | FL | 14 | 13 | Yes |
| LA | FL | 8 | 6 | Yes |
| *These do not include waiver trips that were not reported to MARAD | ||||
| State of Loading | State of Unloading | Journey Completed by | Total Number of Voyages* | Do Waiver Vessels Complete this Route? |
|---|---|---|---|---|
| TX | FL | JA Fleet/ATBs | 246 | Yes |
| FL | TX | JA Fleet/ATBs | 245 | No |
| LA | FL | JA Fleet/ATBs | 216 | Yes |
| FL | LA | JA Fleet/ATBs | 215 | No |
| NY | NJ | ATB Only | 132 | No |
| NJ | NY | ATB Only | 113 | No |
| WA | CA | JA Fleet/ATBs | 89 | Yes |
| CA | WA | JA Fleet/ATBs | 76 | No |
| AK | WA | JA Fleet/ATBs | 66 | No |
| FL | MS | JA Fleet/ATBs | 64 | No |
| *This is calculated starting on April 27, 2026 for Jones Act tankers and July 1, 2026 for ATBs | ||||
CONCLUSION
While the waiver vessels have completed voyages that are not sailed by either the Jones Act tankers or ATBs, it is notable that the vast majority of waiver vessels completed journeys that were also completed by the domestic fleet. These voyages were completed by waiver vessels with no documented impact on Jones Act tankers or ATBs, as demonstrated by their high activity and lack of availability to transport waiver cargo, in addition to their regular voyages. This indicates that the Jones Act tankers and ATBs are not sufficiently meeting the needs of these regions.
While some have argued that waiver vessels are following the same routes as the domestic fleet, this analysis demonstrates that this is untrue for the majority of port-to-port waiver routes. Notably, waiver vessels have increased connection between Puerto Rico and the mainland United States, a route only completed by a limited number of Jones Act tankers, and have increased connection between the Gulf and the West Coast, a journey made by only a limited number of ATBs and Jones Act tankers.
Taken together, the evidence suggests waiver vessels have not displaced the domestic fleet so much as supplemented it, carrying cargo on routes where Jones Act tankers and ATBs were already fully occupied and opening connections the domestic fleet serves only thinly.