
EXECUTIVE SUMMARY
This report updates Balsa Research's 2025 operational analysis of the Jones Act fleet, tracking the movements of oceangoing Jones Act-eligible vessels over a 60-day period (May 1–June 30, 2026). The 2026 study period coincided with the longest continuous Jones Act waiver in history, issued in response to threats to Strait of Hormuz shipping and covering roughly 659 categories of energy commodities and fertilizer inputs.
Between the two study periods the fleet shrank by one vessel to 92, after the reflagging and scrapping of the Mokihana. No new vessels entered the fleet. Of the 92 vessels, 85 were active during the study period: the same number as in 2025. Across both years, approximately 83% of cargo vessels (30 of 36) and 96–98% of tankers (54–55 of 56) were active at any given time, with most inactive vessels undergoing maintenance.
Cargo vessels continued to serve fixed routes connecting the contiguous United States with Hawaii, Alaska, Puerto Rico, and Guam, with no meaningful cargo service between contiguous U.S. ports. The tanker fleet primarily delivered petroleum products to regions lacking pipeline infrastructure. Routes, port calls, and volumes remained largely unchanged from 2025, and the Jones Act waiver does not appear to have altered any operational patterns.
INTRODUCTION
Typically, fewer than one hundred oceangoing vessels can legally move goods from one port in the U.S. to another. This has resulted in less than 5% of domestic freight being transported by water in the United States, despite its thousands of miles of coastline.
In 2025, Balsa Research conducted an Operational Analysis of the routes of the 93 Jones Act-eligible* ships used for domestic transport, then analyzed their movements over a 60-day period (July 1-September 1, 2025).
The findings of the 2025 analysis demonstrated that cargo and fuel routes provided vital goods to Hawaii, Alaska, Puerto Rico, and Guam, yet provided very limited service in the contiguous U.S., with the exception of petroleum product deliveries to areas where pipeline infrastructure is insufficient.
Balsa Research conducted a follow-up analysis for May 1–June 30, 2026. This period fell within the Trump administration's emergency Jones Act waiver**, invoked on March 17, 2026 in response to threats to Strait of Hormuz shipping from the Iran conflict, which suspended Jones Act requirements across roughly 659 categories of energy commodities and fertilizer inputs. The initial 60-day waiver was extended in May through August 16, 2026.
Despite this significant loosening of the regulatory regime, observed routes and volumes in 2026 closely tracked those documented in 2025, indicating that the waiver had little effect on actual shipping patterns.
*The Jones Act refers to 46 U.S.C. § 55102, originating from the Merchant Marine Act of 1920, which requires that vessels transporting goods between U.S. ports must be constructed in the U.S. (46 U.S.C. § 12103), U.S. owned, and crewed at least 75% by U.S. citizens or permanent residents. Due in part to the Jones Act, many ports within the U.S., especially those far away from oil pipelines or other modes of transportation, such as rail or truck, rely heavily on international shipments of oil.
**The waiver has since been extended again through November 15, 2026, though with a substantially narrower scope.
METHODOLOGY
Eligible vessels were identified from the U.S. Department of Transportation Maritime Administration (MARAD)’s list of U.S. Flagged Vessels from March 2026 (the latest available at time of analysis). From MARAD’s list of self-propelled, privately-owned U.S.-flag vessels of 1,000 gross tons and above, vessels that were marked as “Jones Act Eligible” were identified and then tracked in Vessel Finder. The movements of those vessels in the study period were then compared to their movements in 2025.
Vessels with minimal activity (fewer than 5 port calls) during the 60-day study period were considered inactive, consistent with the threshold used in the 2025 analysis. Vessels that were technically active but spent over 20 days in a single port stay were defined as semi-active, to distinguish between vessels running consistent cargo routes and those whose operations were substantially interrupted by maintenance, scheduling changes, or unknown causes.
The number of unique ports visited by each vessel, the number of visits at each port, and draft measurements of each vessel were recorded for the study period and form the basis of analysis.
Limitations
This two-month operational snapshot provides substantial data on current trading patterns but may not capture seasonal variations in shipping routes or volumes. While the months of data collection were slightly different in 2026, both depicted summer months and therefore do not address potential seasonal variations in the use of the Jones Act-eligible fleet.
FLEET OVERVIEW
92 Jones Act-eligible vessels at 1,000 gross tons or more were tracked in the analysis (Table 1), one fewer than in 2025 due to the reflagging and subsequent ineligibility of the Mokihana (1983, IMO 7908005).
While 85 vessels were active, several vessels had notably long port stays, with five vessels (three cargo ships and two tankers) spending over 20 days in a single port stop.
No new ships were added in 2026. The containership Russell G*** (1980, IMO 7729459), initially marked for scrapping, is now being retrofitted outside of the U.S. to further prolong its operating lifespan.
***Renamed from the Horizon Spirit
| Ship Type | 2025 | 2026 | ||
|---|---|---|---|---|
| Active Vessels | Inactive Vessels | Active Vessels | Inactive Vessels | |
| Tankers | 54 | 2 | 55 | 1 |
| Cargo Vessels | 31 | 6 | 30 | 6 |
| Sum | 85 | 8 | 85 | 7 |
| Total Vessels | 93 | 92 | ||
| Data sourced from MARAD's list of U.S. Flagged Vessels (March 2026). In 2026, one cargo ship was re-flagged and sent for scrapping. See the Appendix Tables 2 and 3 for a detailed breakdown of the Tanker and Cargo Vessels. | ||||
CARGO VESSEL OPERATIONS
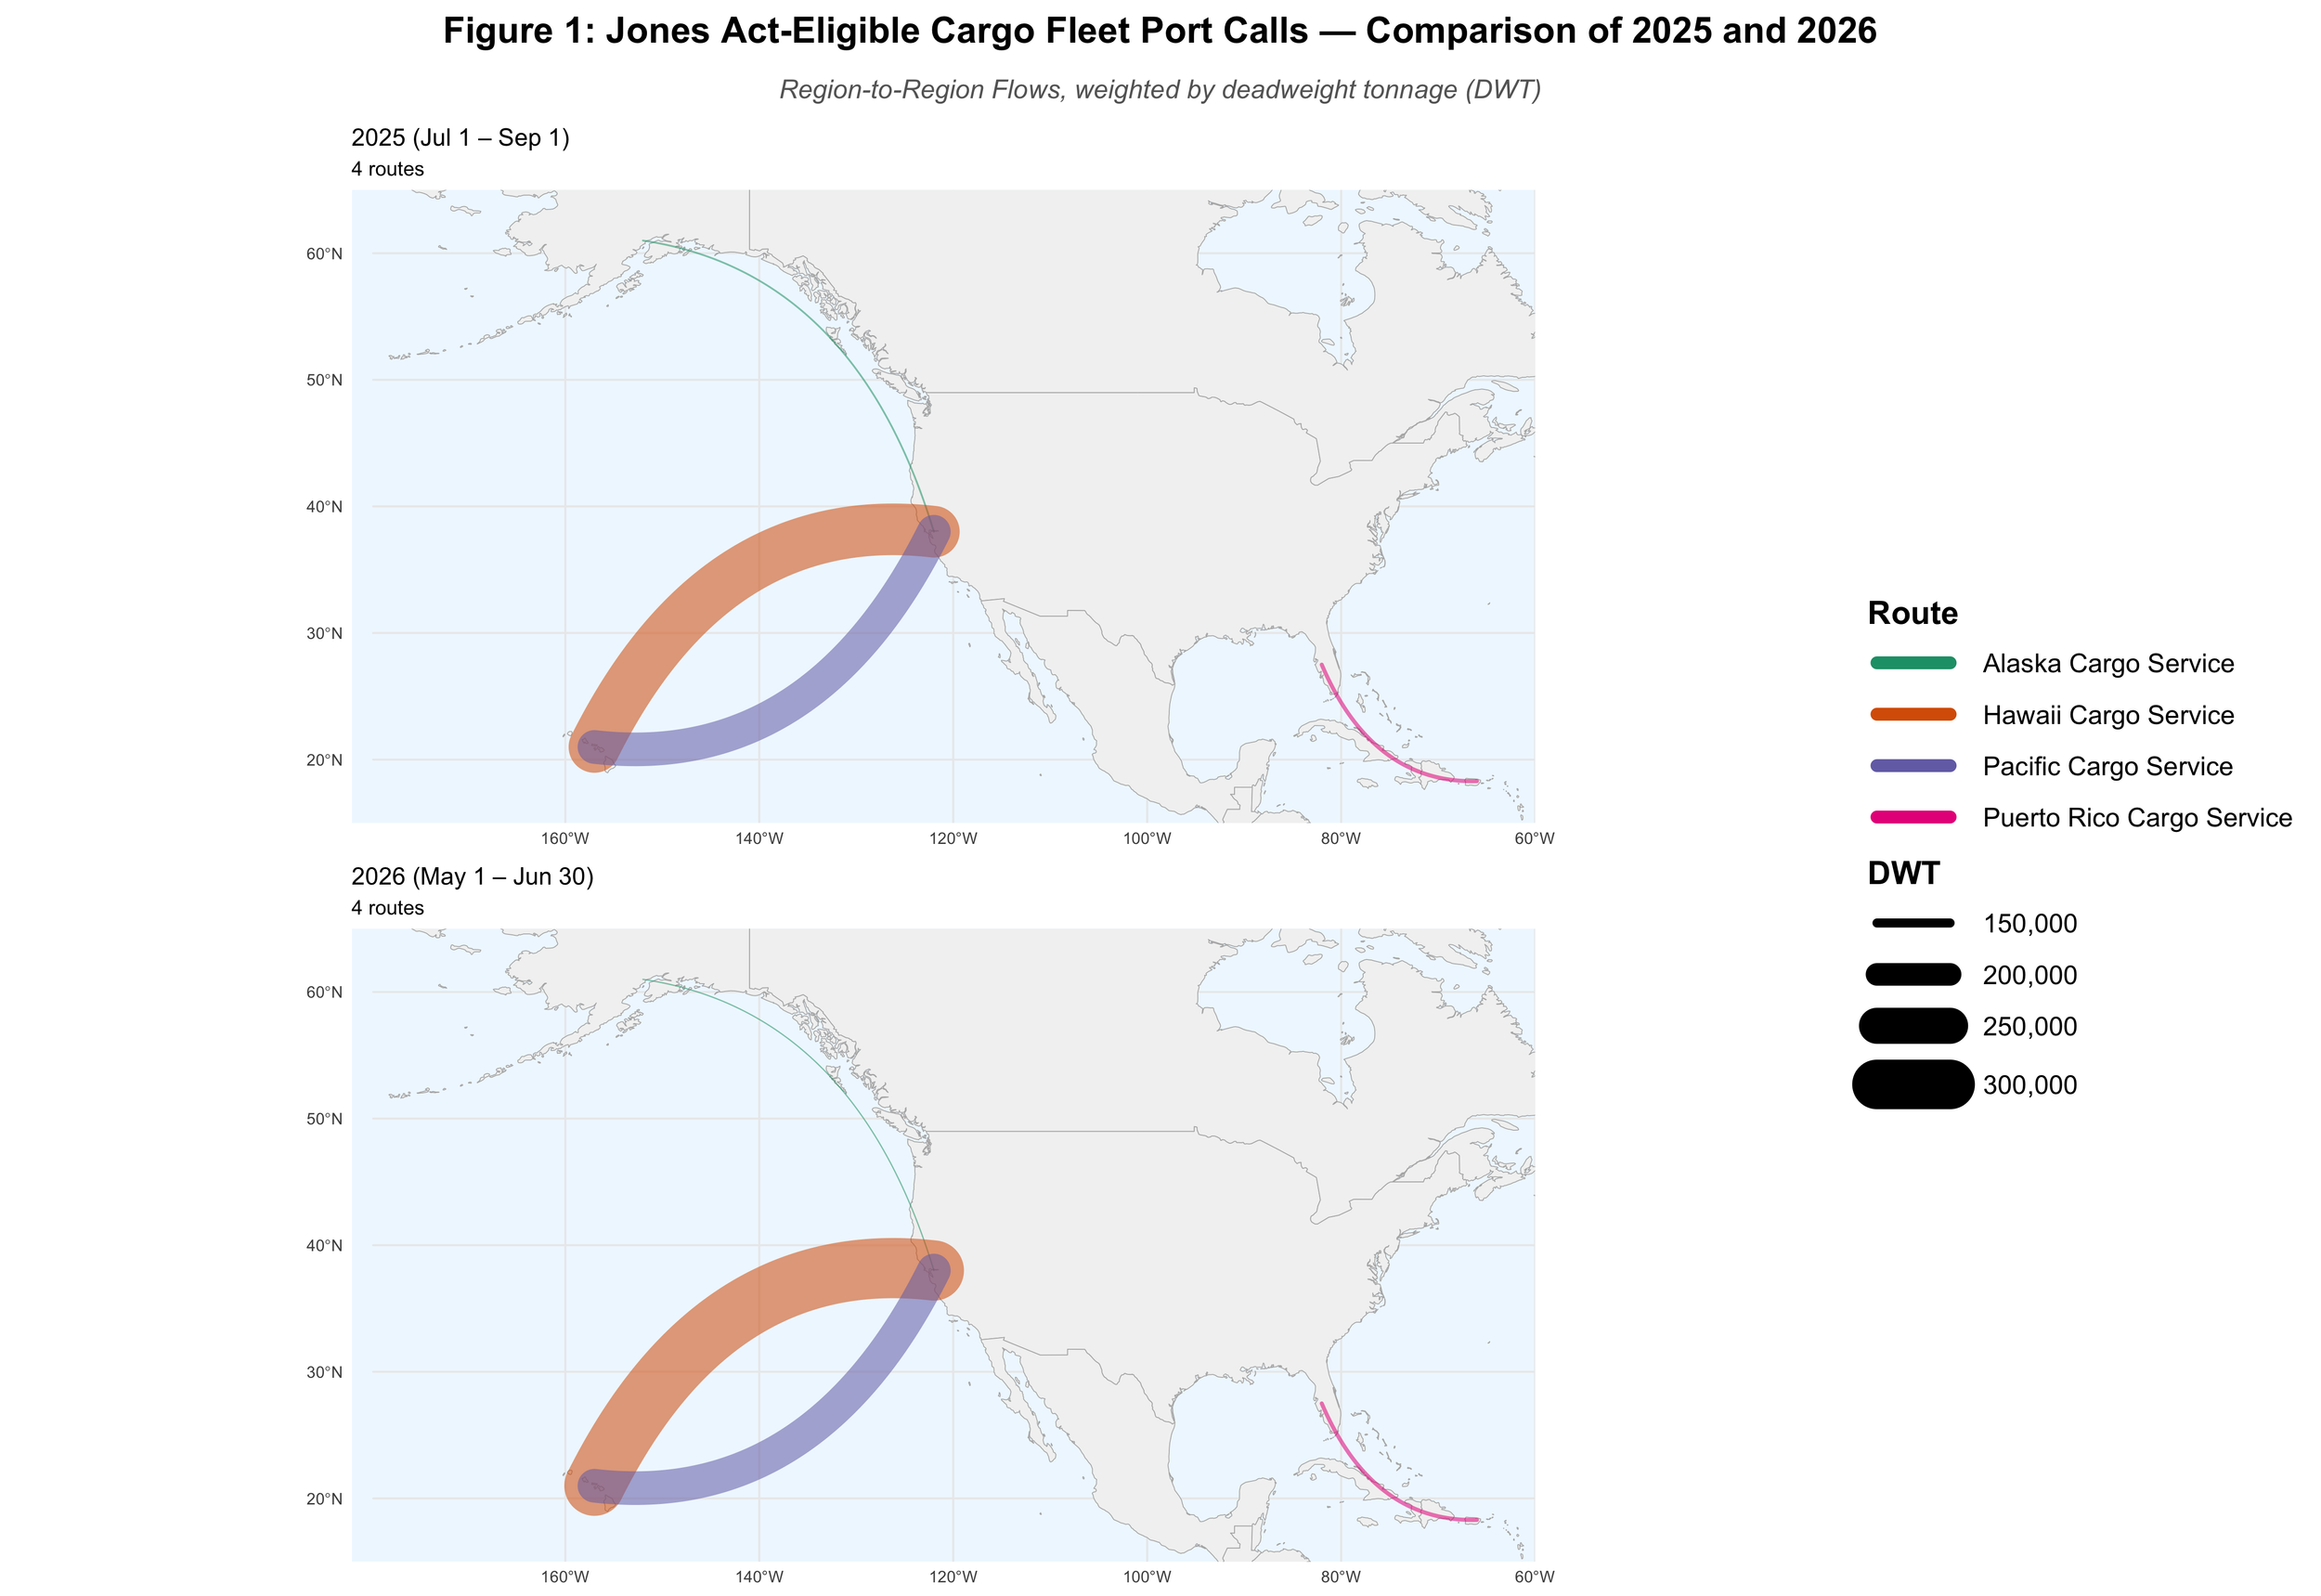
Jones Act-eligible cargo vessels maintain regular service on fixed routes connecting the contiguous United States with non-contiguous states and territories. The cargo fleet's average build year is 1999.
Jones Act-eligible cargo vessels do not transport any cargo between any two ports in the contiguous U.S., except incidentally in their service of the non-contiguous U.S. states and territories. The sole exception to this is the Rocketship (2000, IMO 9198501), a small specialized vessel used exclusively to transport rocket parts from Alabama to Floridian and Californian rocket launch sites.
The routes traveled by vessels remain largely unchanged from 2025 to 2026 (Figure 1), with the Jones Act Fleet serving the same ports at approximately the same rate. This is consistent with the waiver's scope, which covered energy commodities and fertilizer inputs rather than containerized goods, vehicles, and refrigerated cargo. Even under the waiver, foreign-flag vessels could not lawfully substitute for Jones Act cargo ships on these routes. Detailed breakdowns of each route are available in the Appendix.
Cargo Route Descriptions
Hawaii Cargo Service:
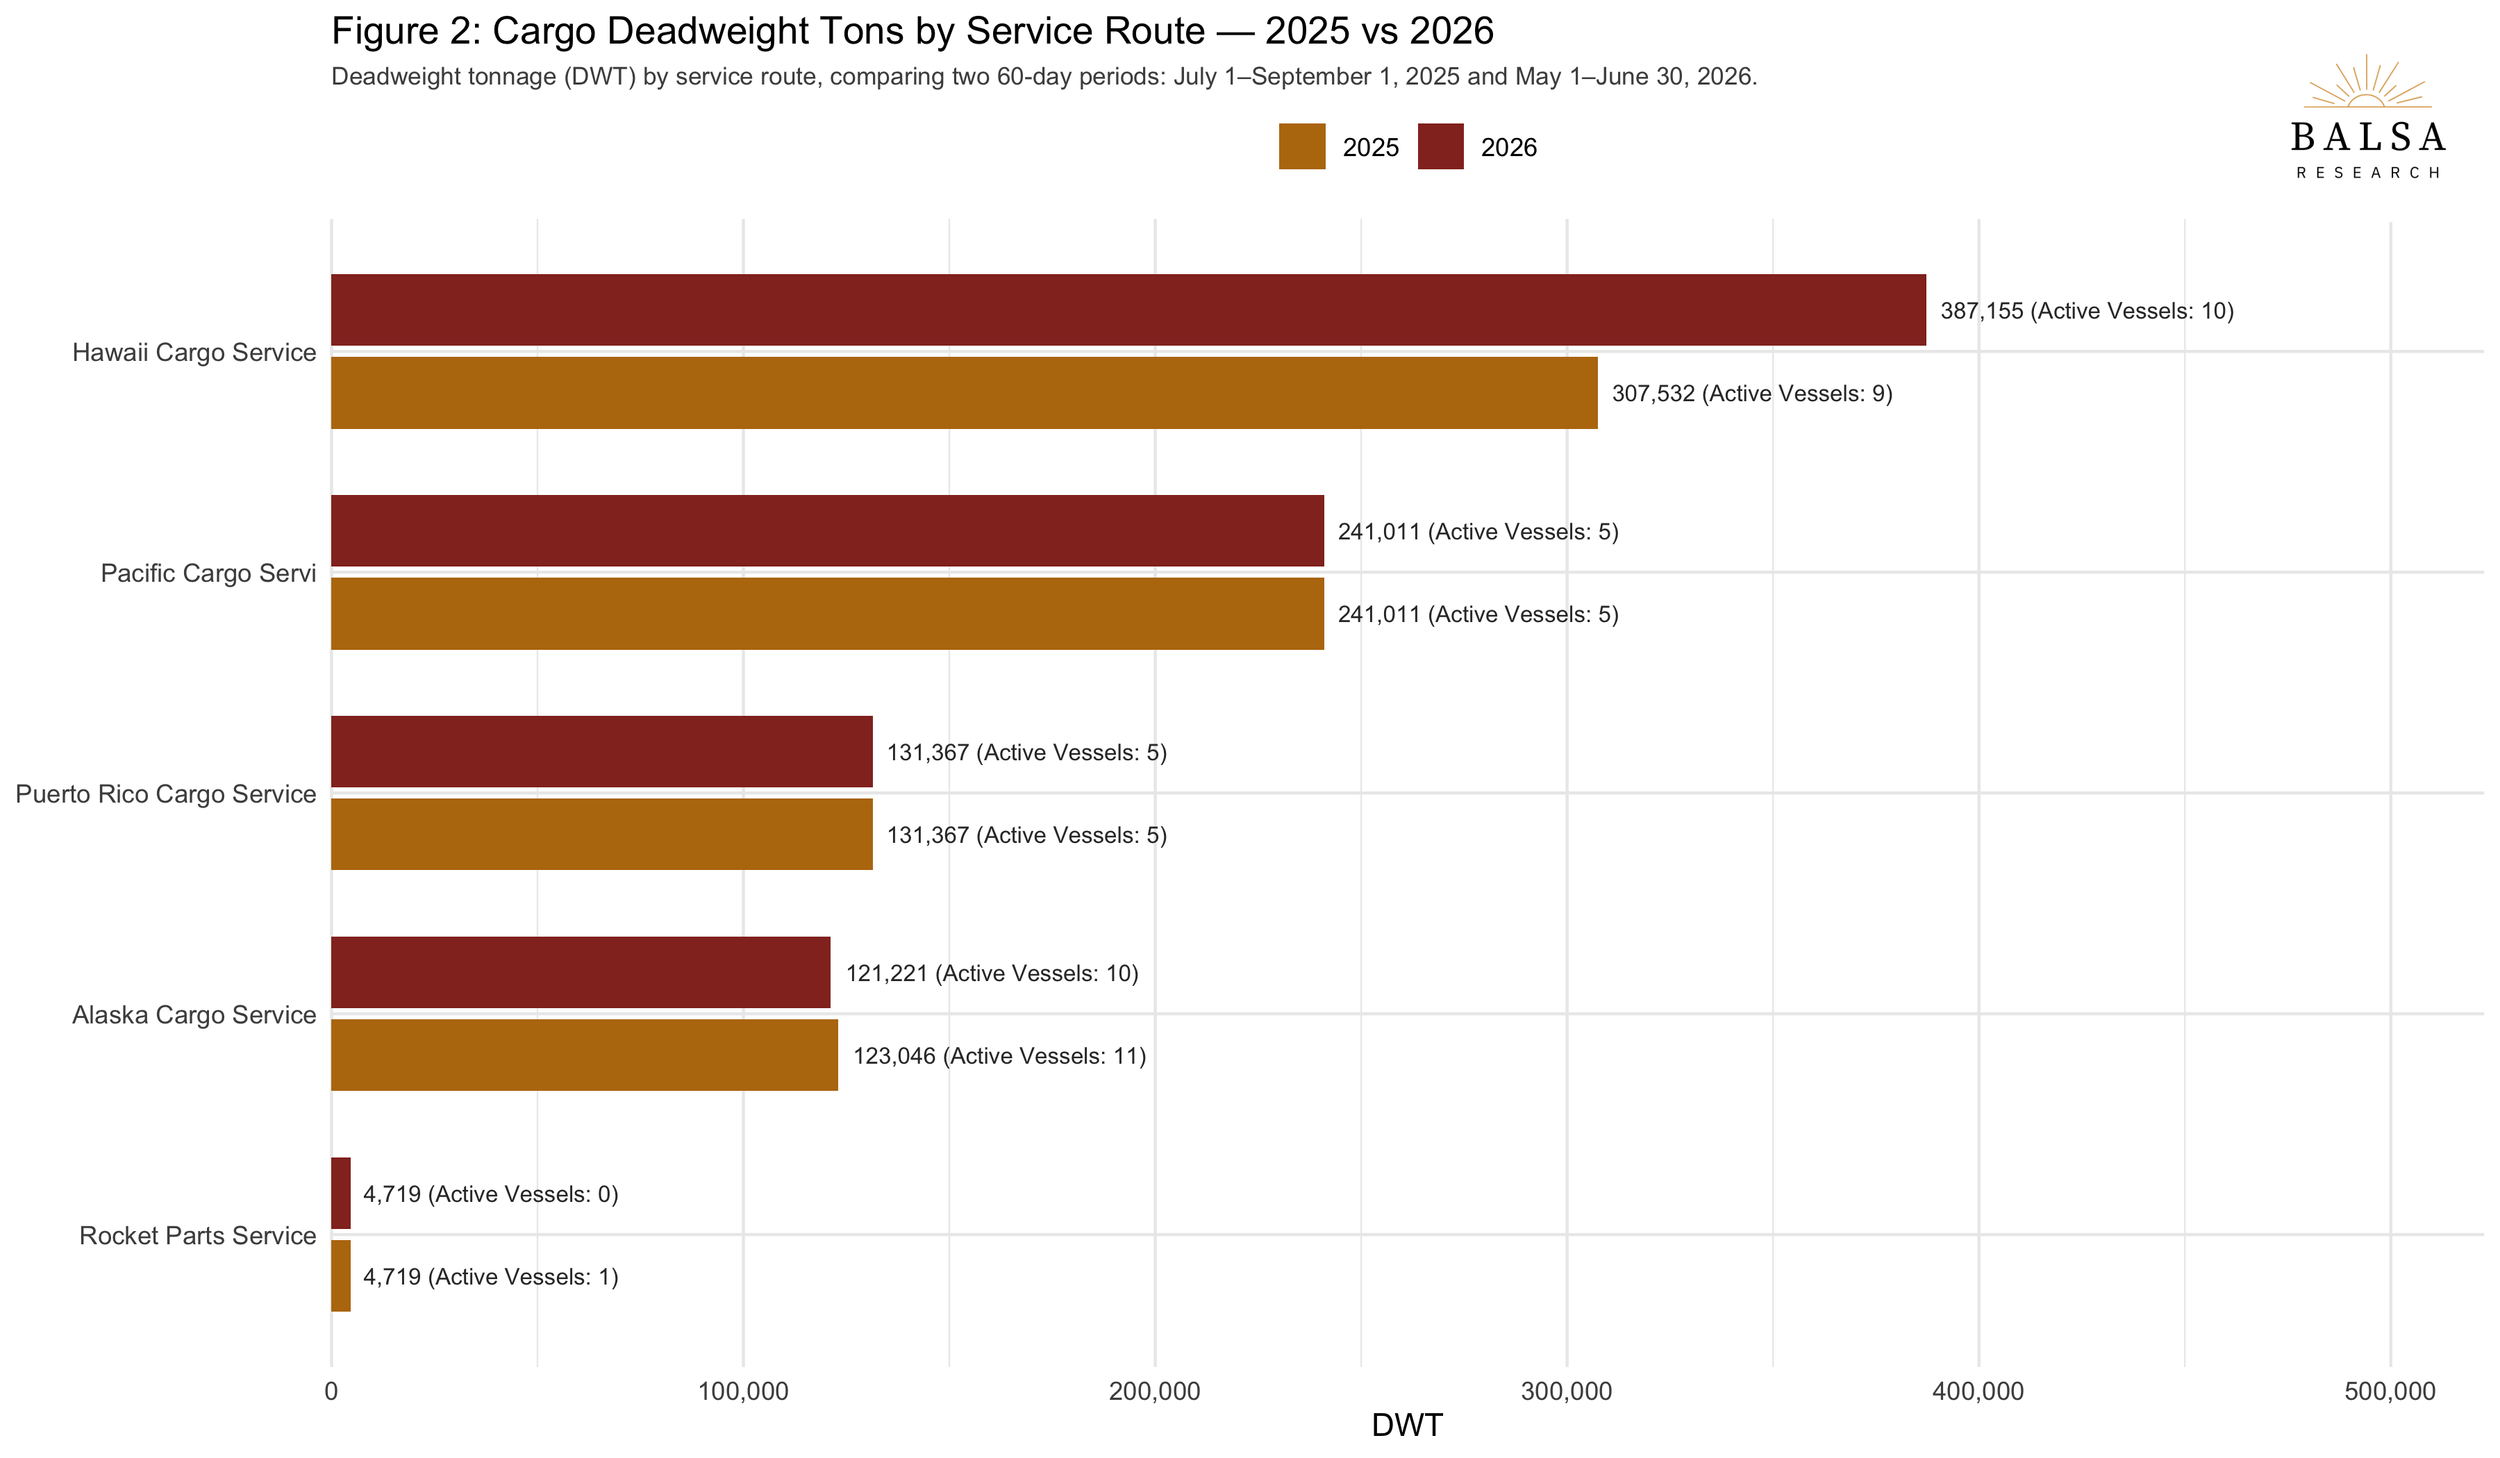
During the 2025 study period, nine container ships were active in service to Hawaii, with two vessels under repair. Both of those vessels returned to actively running cargo routes in 2026, yet the total number of container ships employed on this route only increased by one as a third cargo ship underwent repairs during the observation period.
Compared to 2025, there was little difference in either the ports visited or the number of deliveries to Hawaii. Consistent with observations in 2025, cargo vessels delivered goods to Hawaii and returned to the mainland with a decreased draft measurement, indicating ships were not resupplied with cargo.
Pacific Cargo Service:
In 2026, the number of vessels transporting cargo remained steady at five, but there was a decrease in the number of trips (49 in 2026 versus 56 in 2025). These routes were generally characterized by delivering goods from the West Coast of the U.S. to Guam and Japan, and then picking up goods from China.
Puerto Rico Cargo Service:
During 2026, there were no changes to the number of vessels transporting cargo, but there were more total port calls along the Gulf to Puerto Rico route (83 visits in 2026 versus 70 in 2025). Cargo overwhelmingly traveled from the mainland U.S. to Puerto Rico, with ships returning lighter, indicating less cargo.
Alaska Cargo Service:
The number of vessels on this route decreased from eleven to ten. Despite this reduction, there were more total deliveries to Alaska in 2026, though fewer ports were visited.
Semi-Active Cargo Vessels
The Coastal Progress (1988, IMO 8855463) is one of five small refrigerated vessels generally servicing Alaska. Notably, over the study period it spent 51 days in a single port stay.
The Maunalei (2006, IMO 9273674) spent 43 days in a single port stay during the 2026 study period. It was also tagged as an inactive vessel during the 2025 study period.
Inactive Cargo Vessels
The Mahimahi (1983, IMO 7907996) spent the entire study period docked in Singapore.
The Coastal Trader (1963, IMO 5408491) made only one port call in the final week of the study period. Because of the low activity, the Coastal Trader was excluded from the total counts of active vessels.
The Russell G (1980, IMO 7729459) is currently being converted in China to run on LNG, having received confirmation from the Coast Guard in 2025 that doing so would not disqualify the vessel from the Jones Act.
During the study period, the Rocketship (2000, IMO 9198501) was not active. The Rocketship is a specialty Ro-Ro used exclusively for the transportation of rocket components.
The Sea Trader (1976, IMO 7517698) was last active in 2023, and The Geysir (1980, IMO 7710733) was last active in 2017.
The Mokihana is no longer U.S. flagged, but is flagged under St. Kitts and Nevis, a flag of convenience often applied to ships for scrapping.
TANKER VESSEL OPERATIONS
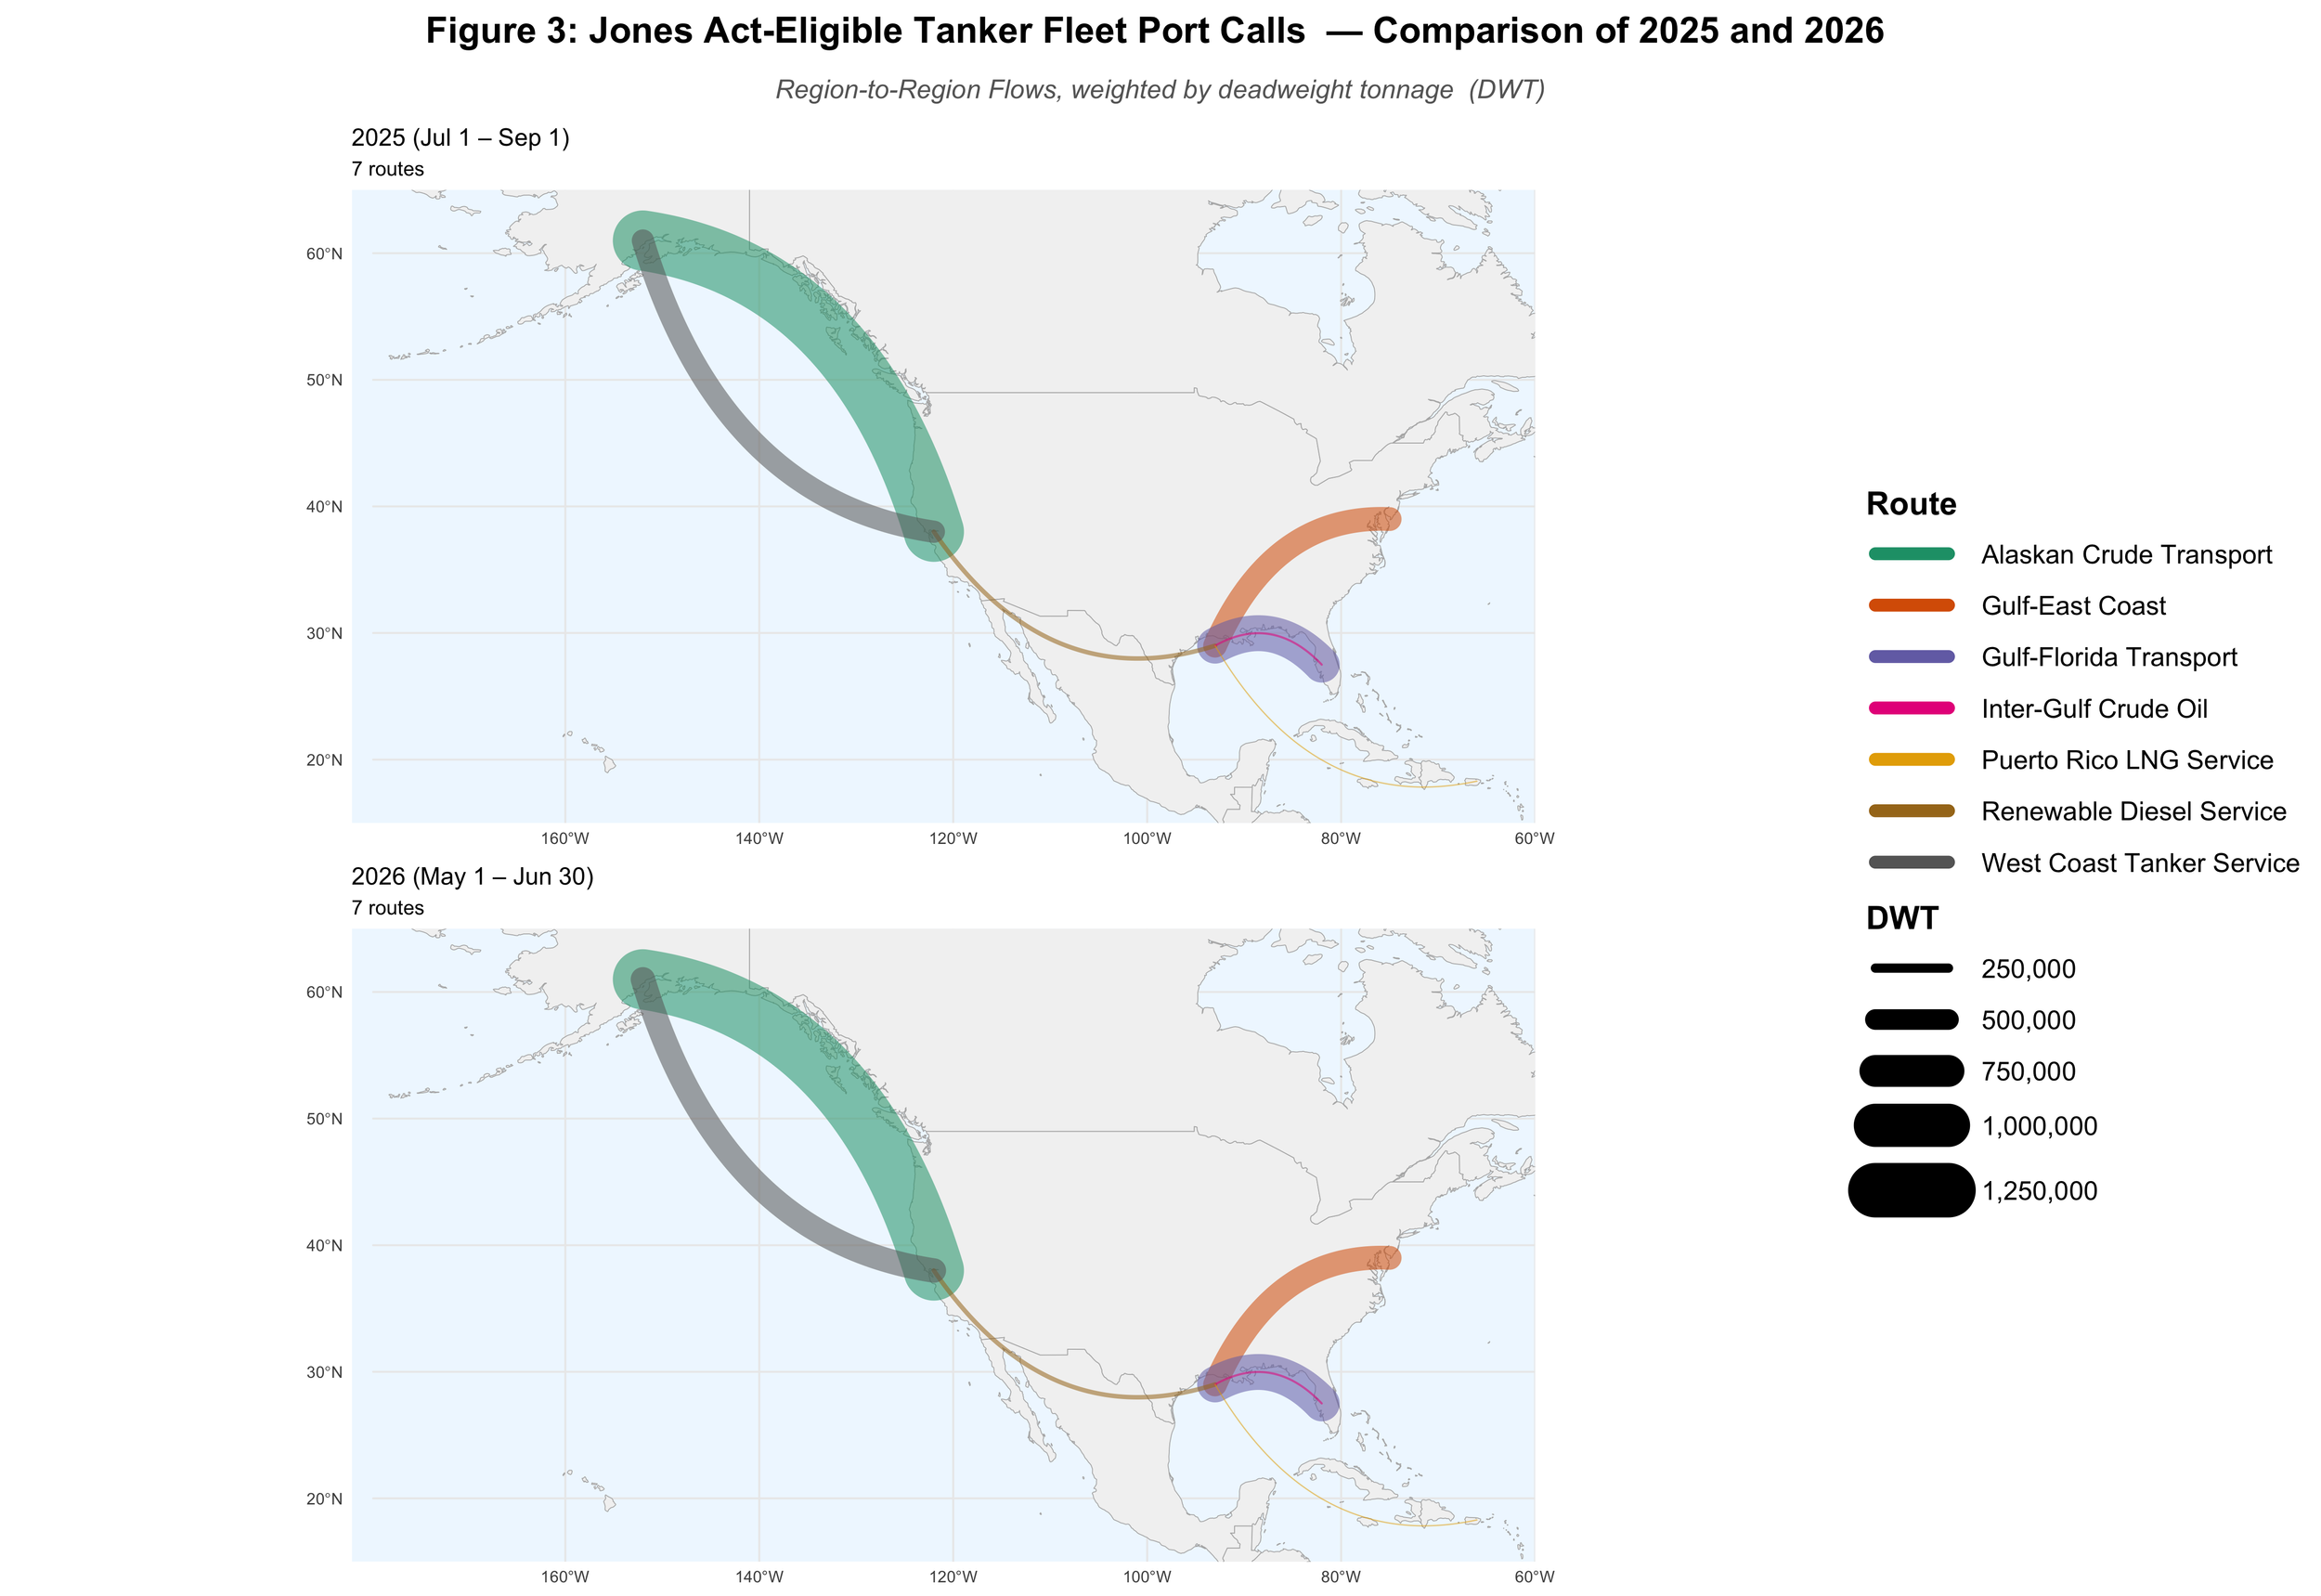
The tanker fleet, with an average build year of 2008, primarily serves routes where pipeline infrastructure is absent or insufficient for petroleum product demand (Figure 3).
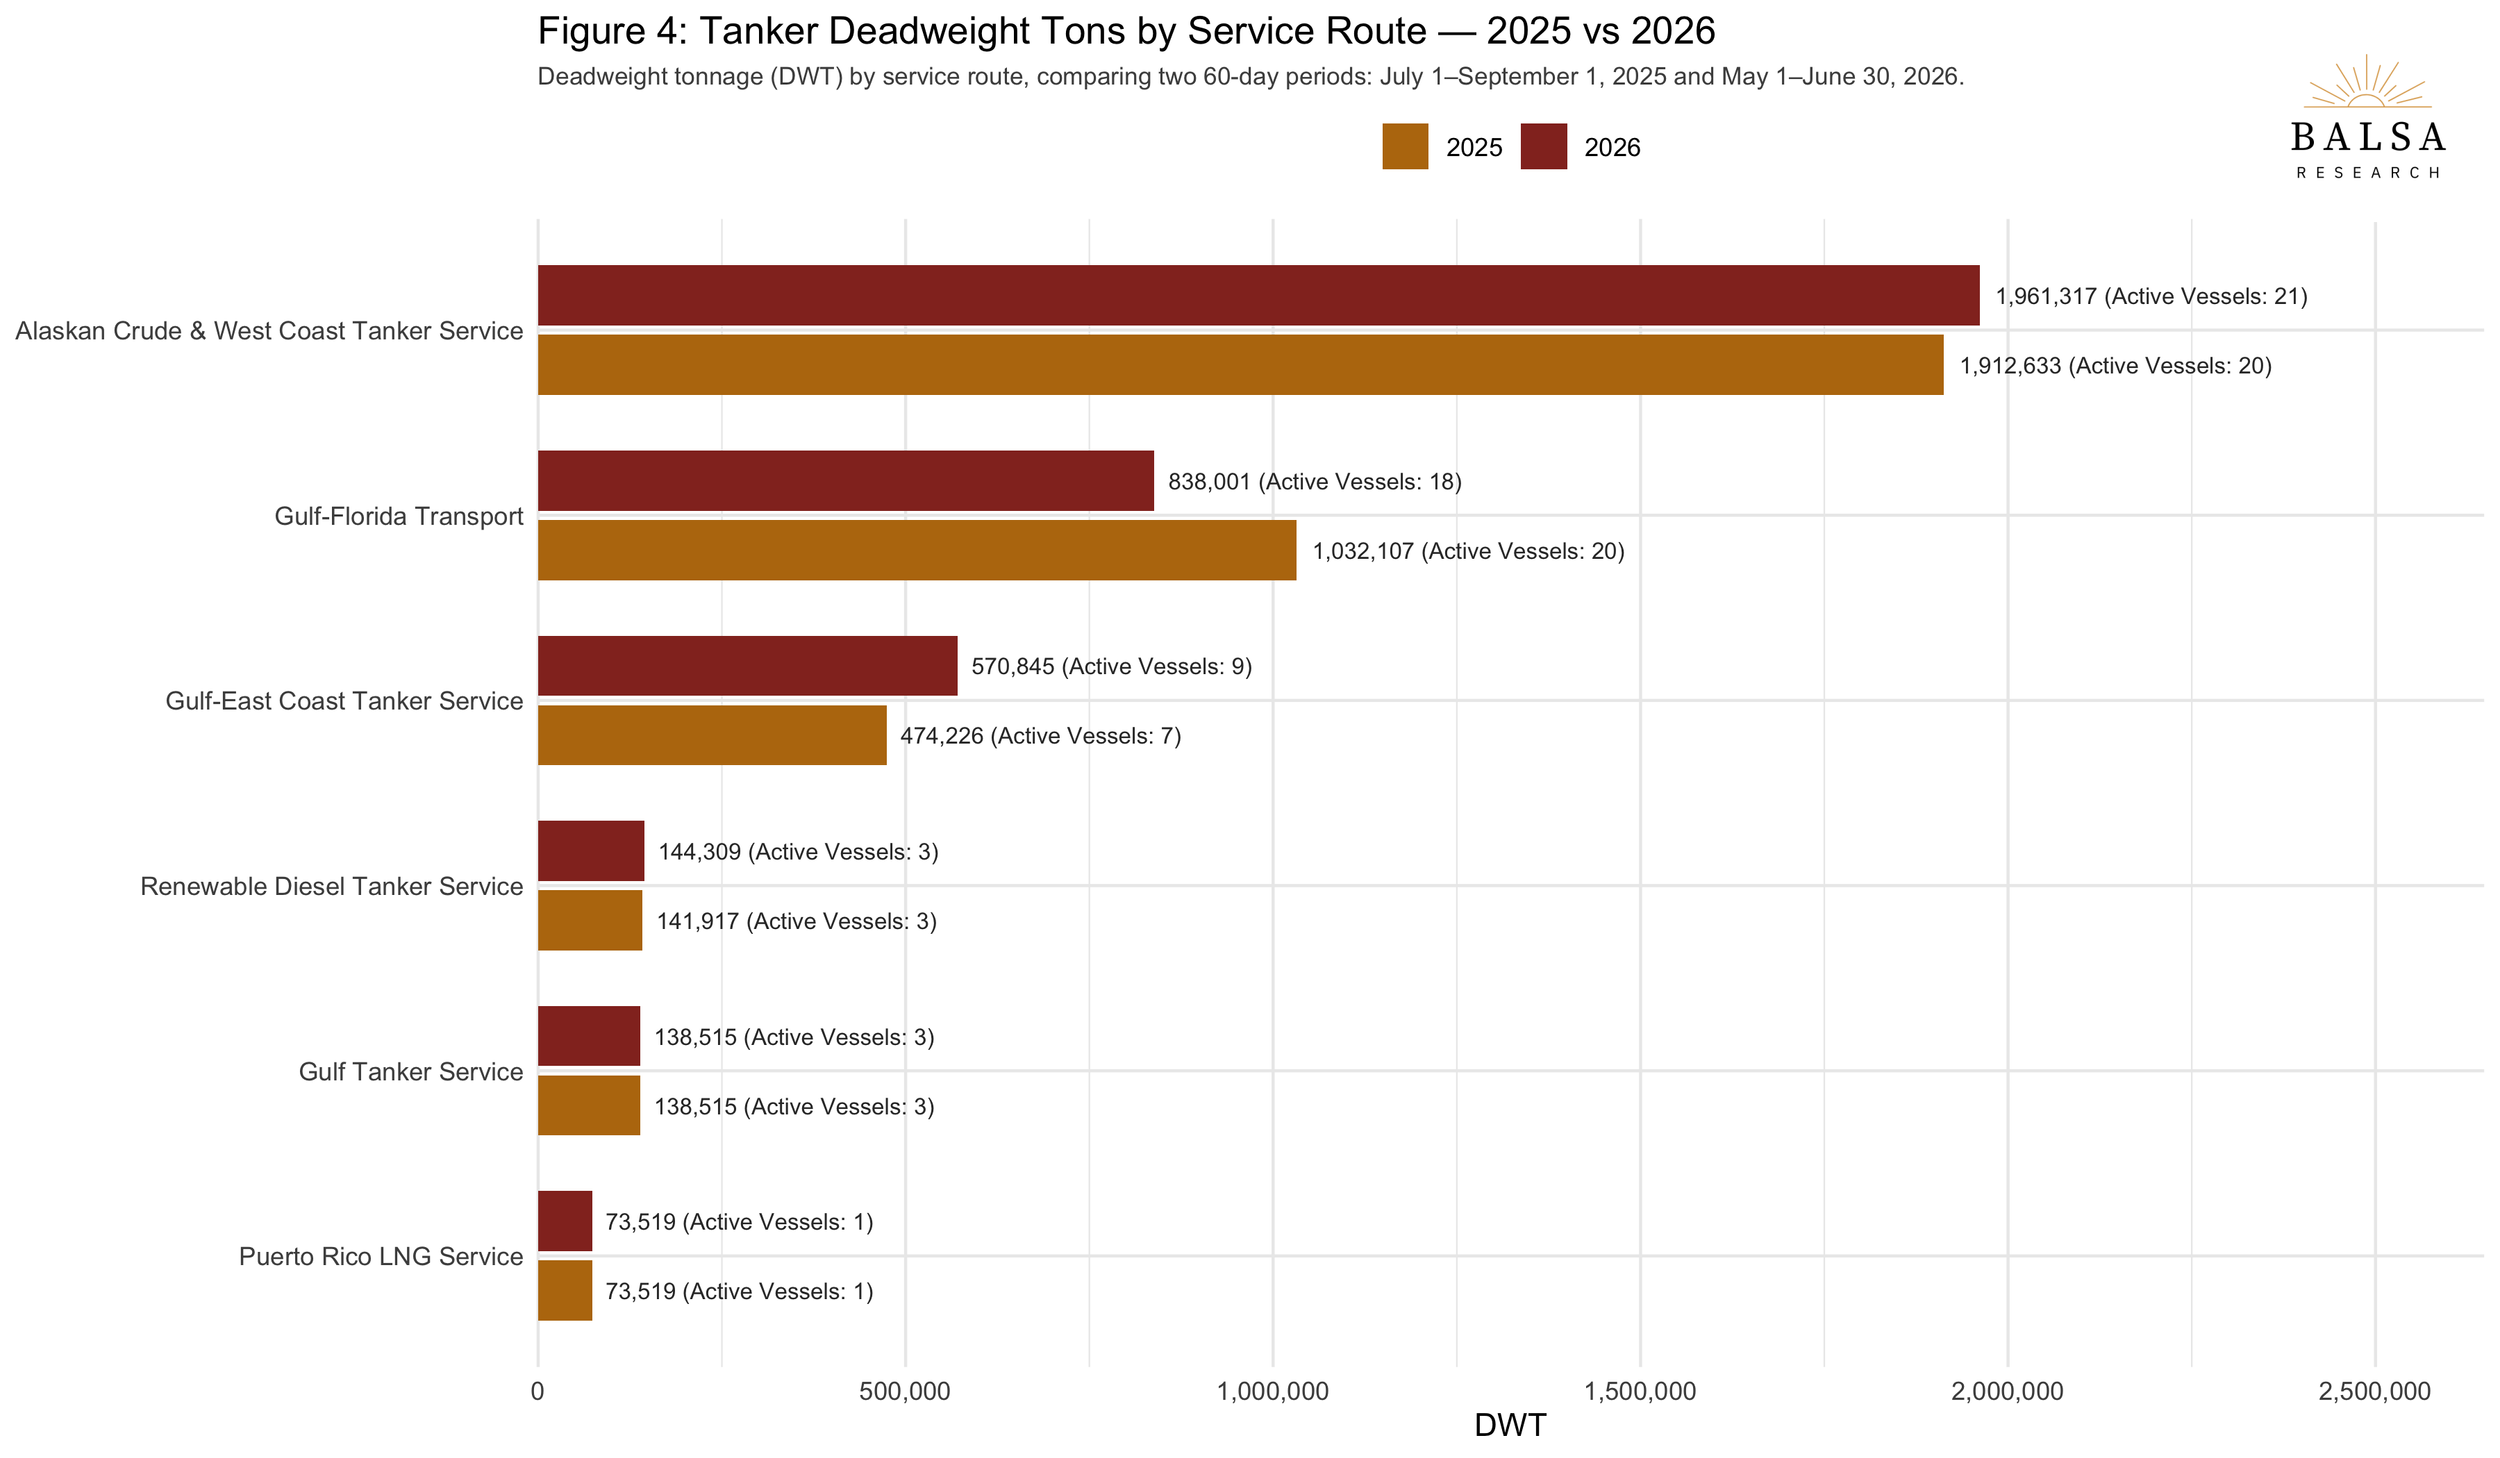
While there was little change in the number of Jones Act ships operating (Figure 4), there was a slight shift in routes between 2025 and 2026, particularly those along the East Coast. Detailed breakdowns of each route are available in the Appendix.
Tanker Route Descriptions
Alaskan Crude Oil and West Coast Tanker Service:****
During the 2026 observation period, one fewer vessel transported crude oil from Alaska to the West Coast of the U.S. (Figure 4). There was a 17% reduction in the number of port visits (113 in 2025 compared to 94 in 2026), likely due to this. However, the number of unique ports visited increased by 1, from 16 to 17.
There was a 20% increase in the number of port calls between 2025 and 2026 (148 in 2025 versus 178 in 2026) for deliveries of chemical and oil products along the West Coast.
Gulf-Florida and Gulf-East Coast Tanker Routes:
Several tankers active along the Gulf coast altered their routes and traveled further north along the eastern seaboard when compared to 2025. Similarly, many of the ships that transported oil between the Gulf Coast, Florida, and the East Coast in 2025 shifted their routes in 2026, with a majority traveling between the Gulf and Florida.
A total of 363 port visits were made to the Gulf, Florida, and the East Coast, compared to 360 in 2025. While many vessels experienced changes in exact routes, there was little change in overall vessel activity.
Based on changes in draft measurements, the general trend appeared to be that oil was delivered from the Gulf Coast refineries to ports in Florida and the East coast.
Gulf Coast:
Crude oil and chemical/oil products were moved through the Gulf at approximately the same rate as 2025, though more trips were made in 2026.
In both years, there were only two crude oil tankers serving the East coast, with the majority of crude oil transport transported by Jones Act-eligible vessels occurring on the West Coast. The East coast often ships crude oil from the Gulf via river or rail, and also receives international shipments of oil.
Renewable Diesel Service:
As in 2025, three vessels traveled from the East Coast through the Panama Canal to bring renewable diesel to California (Figure 4). While the precise vessels changed, the overall number of deliveries stayed consistent.
Puerto Rico LNG Service:
There is still only one Jones Act-eligible vessel that transports LNG to Puerto Rico. The American Energy (1994, IMO 9030802) made seven trips during the 2026 60-day period, compared to five in 2025.
Semi-Active Tanker Vessels
Two tankers, the Florida Voyager (2016, IMO 9698018) and the Magnolia State (2016, IMO 9697997) spent over twenty days in port for unknown reasons during the study period.
Inactive Tanker Vessels
The Polar Enterprise’s (2006, IMO 9250660) AIS hadn’t been updated since it was in San Francisco on April 23rd. The Polar Enterprise was likely undergoing maintenance in South Korea, where other tankers from the same company received maintenance last year.
****In Balsa’s 2025 operational analysis, Alaska Crude Transport included those vessels that are "Crude Oil Tankers" as well as those that are "Chemical/Oil Tankers" (which may or may not transport Crude oil). In 2026, only Crude Oil Tankers were included in the Alaska Crude Transport Route, while Chemical/Oil Tankers that travel between Alaska and the West Coast were re-categorized with other West Coast tankers for increased precision.
CONCLUSION
Consistent with activities in 2025, oceangoing vessels in 2026 provided minimal service between contiguous U.S. ports. Jones Act-eligible vessels continue to largely serve routes where land-based transportation is not a viable alternative. Balsa found little significant difference between the vessel operations in 2025 versus 2026.
While both 2025 and 2026 cover a 60-day snapshot of Jones Act cargo activity, the data provides insight into the amount of ships running at a given time. Based on these two snapshots, it can be assumed that only 31 of available 36 (83%) Jones Act cargo vessels are active at any given time.
When viewing the tanker activity holistically, there was little change in the number of vessels and number of trips made, though there were slight changes to some of the routes. Based on this data, it can be assumed that 96–98% of Jones Act tankers (54–55 of 56) are active at any given point in time.
Despite coinciding with the longest continuous Jones Act waiver in modern history, the 2026 data show no meaningful change in the routes, port calls, or activity levels of Jones Act vessels relative to 2025.