
Jones Act Fleet Constraints and Unmet Domestic Demand for U.S. Petroleum Products in Petroleum Administration for Defense District (PADD) 5:
Evidence from the 2026 Jones Act Waivers and Concurrent Events
October 2026 | PDF
EXECUTIVE SUMMARY
Many critics of the Jones Act have argued there is unmet U.S. demand for domestic petroleum products due to the Jones Act tanker fleet’s limited capacity, availability, and carrier costs. While pipelines move petroleum products from the Gulf of Mexico to many U.S. regions, certain locations, like the West Coast and parts of the East Coast, have limited access to pipeline infrastructure and depend on maritime transport to meet demand that exceeds locally produced supply. While the Jones Act fleet carries some domestic petroleum products to the West and East Coasts, these regions also import significant volumes from international markets.
Supporters of the Jones Act have responded to these claims by arguing that the regions’ petroleum product imports reflect local refinery closures and domestic petroleum product companies’ business decisions rather than capacity limitations in the Jones Act fleet.*
While studies have estimated how repeal of the Jones Act might impact domestic petroleum product movement,** there had been no waivers of significant duration until this year. Consequently, debates over whether the Jones Act prevents domestic supply from meeting domestic demand had remained largely theoretical.
*It should be noted that neither of these points—a supply/demand gap resulting from PADD 5 refinery closures or domestic producers choosing to export rather than move product to PADD 5–necessarily refutes the claim of Jones Act fleet capacity limitations. For example, export markets might be more attractive or feasible for domestic producers to move their product to specifically because of a lack of Jones Act vessel availability to carry the product to PADD 5. Regarding refinery closures, a supply/demand gap is just that, regardless of its initial cause. If PADD 5 has persistent unmet demand owing to local refinery closures, the analysis presented in this article nonetheless suggests that it is difficult or impossible for domestic suppliers in other PADDs to meet this demand under the Jones Act.
OVERVIEW
In 2025, Balsa Research conducted an Operational Analysis of Jones Act Vessels, analyzing the movements of the 93 oceangoing Jones Act-eligible vessels over a 60-day period (July 1-September 1, 2025). The findings of the 2025 analysis demonstrated that cargo and fuel routes provided vital goods to Hawaii, Alaska, Puerto Rico, and Guam, but also documented limited service in the contiguous U.S., with the exception of fuel deliveries to areas where pipeline infrastructure is insufficient such as the West Coast.
A second operational analysis was conducted for the period of May 1-June 30, 2026 and found no difference in vessel activity despite the ships operating during the longest continuous Jones Act waiver in modern history.
Balsa Research conducted an analysis of the activity of waiver vessels concurrent with its second Jones Act fleet operational analysis. As of October 5, 2026, a total of 298 waiver voyages have been reported to MARAD. A total of 178 unique port-to-port voyages were completed by the waiver vessels, and 128 (72%) of these trips were on routes not traveled by Jones Act vessels or Articulated Tug and Barges (ATBs). Many of these vessels (approximately 20%) are moving petroleum products from the Gulf of Mexico, located in Petroleum Administration for Defense District (PADD) region 3 to the West Coast (PADD 5). During the waiver period, maritime shipments of petroleum products from PADD 3 to PADD 5 broke all previous records. A significant portion of the overall increase in domestic movement of petroleum products that occurred during the waiver period was accounted for by increases in maritime shipping which, given the Jones Act fleet’s continued full utilization, was driven by waiver vessels.
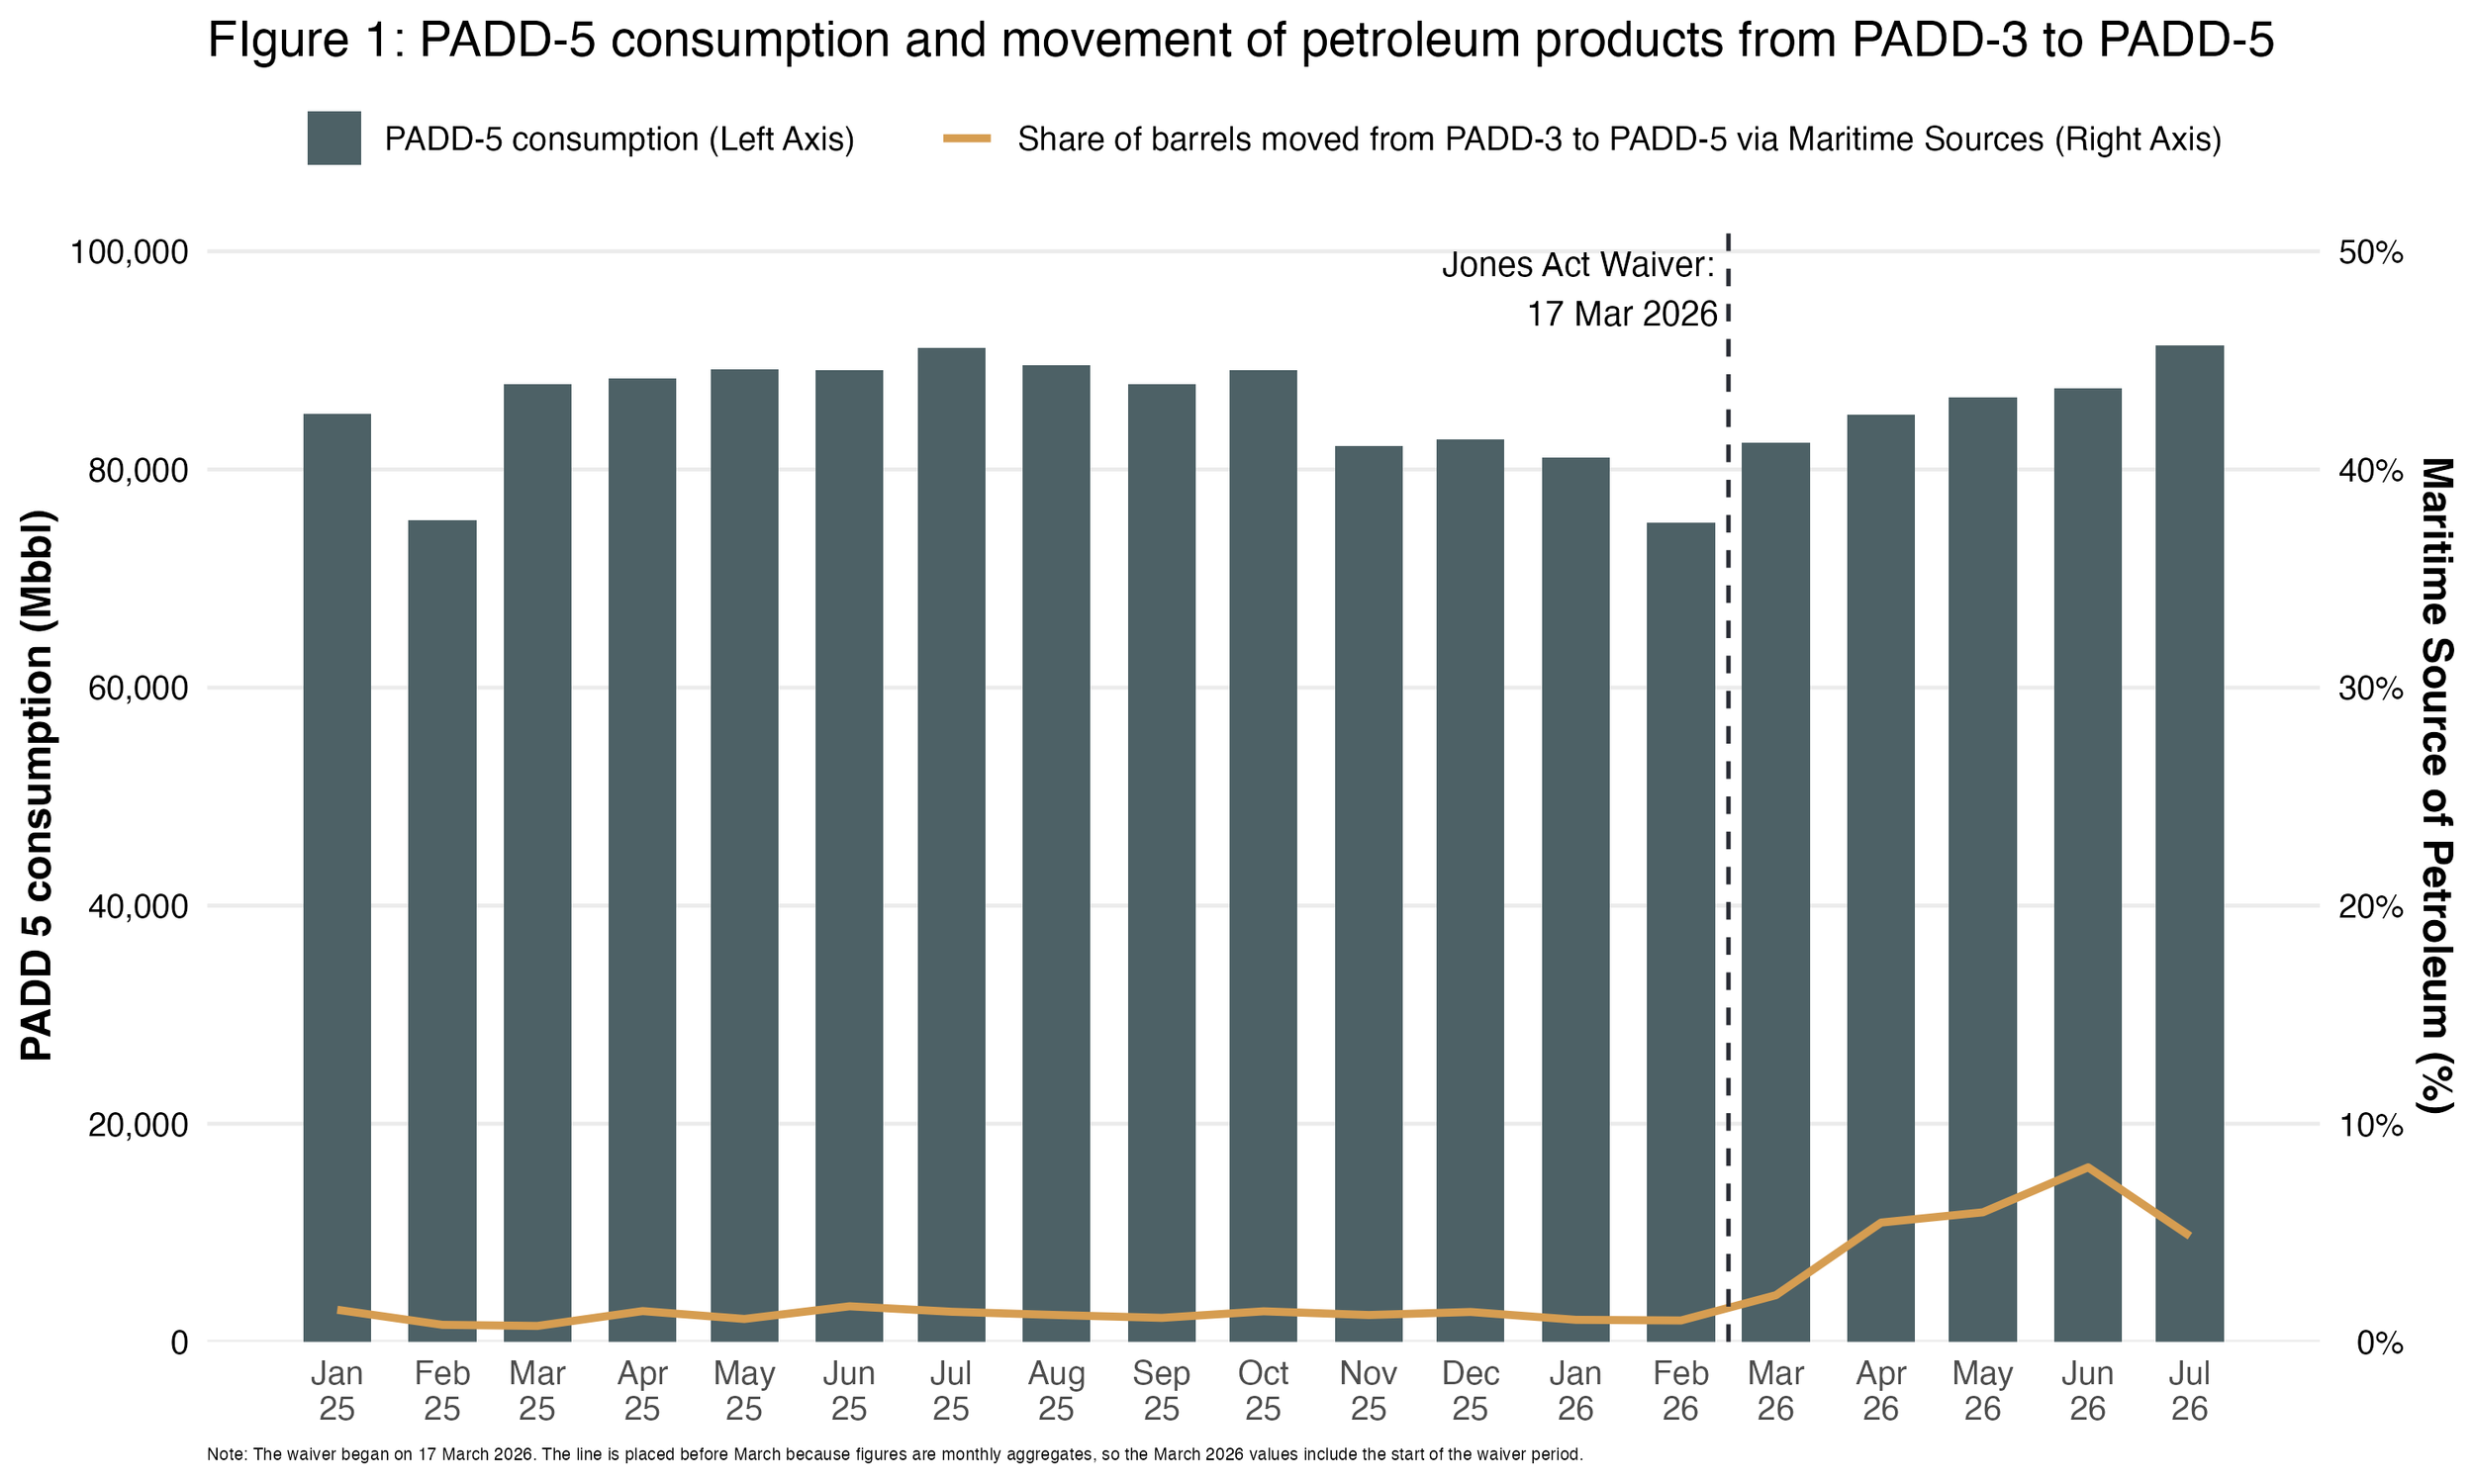
The waiver-period increases in petroleum product movement from PADD 3 to PADD 5 by tanker and barge accounted for 51.3% of the overall March increase in domestic product movement to PADD 5 (Table 1), 198.3% of the April increase, 29.4% of the May increase, and 71.4% of the June increase, as well as 88.3% of the July decrease (which still left both overall domestic petroleum product movements into PADD 5 and barge and tanker-only movements from PADD 3 to PADD 5 significantly higher than in the months immediately pre-waiver).* At the same time, PADD 5’s monthly international imports dipped below immediate pre-waiver levels only once during the waiver period (June), and PADD 5’s own monthly production dipped below immediate pre-waiver levels twice (April and May). In contrast, all five waiver-period months for which data is currently available saw significantly larger volumes of domestic product move into PADD 5. As noted above, PADD 3 to PADD 5 tanker and barge movement, enabled by the Jones Act waiver, accounted for a significant share of this change each month (Figure 1). These facts clearly support the argument that domestic demand levels for petroleum products in at least some regions of the U.S. could not be met via maritime shipment under non-waiver conditions.
It is instructive to compare this data to the equivalent data from 2025, during which no Jones Act waiver was in place. Overall PADD 5 petroleum product consumption, estimated based on the 2026 data from the U.S. Energy Information Administration’s (EIA) “Product Supplied” category, shows a similar pattern of a dip from January to February, then month-to-month increase from February through July. The March-July period of 2025 saw an average monthly petroleum consumption of 89,100 Mbbl, comparable to the 2026 March-July (partial or full months for which the waiver was in place) average monthly consumption of 86,575 Mbbl. The share of consumption met by domestic product movement from other PADDs, however, was higher under the waiver conditions of 2026 than under the non-waiver conditions of 2025: a March-July 2026 average monthly percentage of 22% compared to a March-July 2025 average monthly percentage of 18%. Looking at PADD 3 to PADD 5 movement on tankers and barges only, the 2026 March-July monthly average percentage is 5.2%, over four times 2025’s March-July monthly average percentage of 1.2%.
*Calculated by the authors from EIA data.
THE CASE FOR UNMET DEMAND FOR DOMESTIC PETROLEUM PRODUCTS IN PADD 5
Waiver ship trips from the Gulf Coast to the West Coast carried large volumes of domestically produced petroleum products. While the Jones Act fleet does carry petroleum products on Gulf-West Coast routes, EIA notes that from 2021 to the beginning of the waiver at in March 2026, 96% of waterborne shipments from PADD 3 to PADD 5 were renewable diesel. In most months, renewable diesel was the only petroleum product that moved on this route.
Beginning with the waiver, however, total waterborne petroleum product shipments from PADD 3 to PADD 5 increased dramatically, from 822,000 barrels in January to 4,649,000 barrels in April (a 466% increase), the first full month in which the waiver was in effect, to an eventual high of 6,992,000 barrels in June (a 751% increase from January). While the Jones Act fleet continued to carry renewable diesel to PADD 5 and was consistently at full utilization, these significant additional shipments consisted mostly of domestic petroleum products that are not generally transported to PADD 5 by sea: gasoline blending components, finished motor gasoline, and jet fuel.* The capacity of the Jones Act tankers to transport renewable diesel on the same route is approximately 984,979 bbl.** Overall movements of domestically produced renewable diesel from other PADDs to PADD 5 also increased during the waiver period, hitting two records in May and June 2026, respectively, which supported higher PADD 5 consumption of renewable diesel even as international imports of this fuel dropped to near zero. Meanwhile, for overall petroleum products, inbound movement from other PADDs via all modes of transport (i.e., maritime transport on tankers and barges, as well as pipelines and rail) was higher than pre-waiver for every month of the waiver period for which data is currently available. In other words, waiver-enhanced maritime movements of domestic product did not simply cannibalize other modes of domestic transport.*** Furthermore, international imports of petroleum products to PADD 5 were higher than pre-waiver levels throughout all but two months of the waiver period, and domestic product movement increased even in waiver months when imports did too, suggesting that larger volumes of domestic product movement are not merely replacing imports that are readily available under ordinary circumstances.*** Finally, U.S. monthly exports of petroleum products were comparable to or higher than pre-waiver 2026 numbers in each waiver month for which data is currently available, indicating that domestic petroleum product suppliers are meeting more overall demand rather than rerouting exports to domestic markets.
Taken together, these data points—PADD 5 importing a significant portion of petroleum products from foreign markets before the waiver, significant increases in domestic petroleum product movement to PADD 5 during waiver months, waiver vessel petroleum product movements from PADD 3 to PADD 5 that make up a substantial share of the overall increase in domestic product movement to PADD 5, increased overall consumption of these products in PADD 5, continued full utilization of the Jones Act fleet, including on PADD 3 to PADD 5 routes throughout the waiver period—together with the fact that domestic product movements to other PADD regions and exports to foreign markets concurrently increased, strongly support the conclusion that Jones Act fleet capacity constraints limit the fleet’s ability to meet demand for domestic petroleum products in PADD 5.
An additional data point suggests this unmet demand is not unique to the disruptive conditions in global oil markets in response to which the 2026 waiver was granted: in August 2026, three oil companies–Phillips 66, Kinder Morgan, Inc., and HF Sinclair Corporation—announced that they had finalized a joint venture agreement to build a pipeline system, titled the Western Gateway, connecting the Gulf Coast to the West Coast and Southwest U.S. markets. According to Phillips 66, the project, which has an estimated enterprise value of $5 billion, has “a design capacity of 230,000 barrels per day,” and “is also being developed to allow for future expansion with limited capital and no new pipe necessary as future demand requires.” Phillips 66 Chairman and CEO Mark Lashier has stated that Western Gateway is expected to “deliver a more cost-effective, resilient path for growing markets across the West,” while Kinder Morgan CEO Kim Dang stated that the company expects “to earn attractive returns on our investment based on the incremental project earnings above those of our contributed assets.” The companies’ decisions to invest in a pipeline reflect both their belief in additional and growing demand for domestic petroleum products on the West Coast and, presumably, an assumption that the Jones Act tanker fleet as currently utilized cannot meet this demand via maritime shipping.
An additional data point suggests this unmet demand is not unique to the disruptive conditions in global oil markets in response to which the 2026 waiver was granted: in August 2026, three oil companies–Phillips 66, Kinder Morgan, Inc., and HF Sinclair Corporation— announced that they had finalized a joint venture agreement to build a pipeline system, titled the Western Gateway, connecting the Gulf Coast to the West Coast and Southwest U.S. markets. According to Phillips 66, the project, which has an estimated enterprise value of $5 billion, has “a design capacity of 230,000 barrels per day,” and “is also being developed to allow for future expansion with limited capital and no new pipe necessary as future demand requires.” Phillips 66 Chairman and CEO Mark Lashier has stated that Western Gateway is expected to “deliver a more cost-effective, resilient path for growing markets across the West,” while Kinder Morgan CEO Kim Dang stated that the company expects “to earn attractive returns on our investment based on the incremental project earnings above those of our contributed assets.” The companies’ decisions to invest in a pipeline reflect both their belief in additional and growing demand for domestic petroleum products on the West Coast and, presumably, an assumption that the Jones Act tanker fleet as currently utilized cannot meet this demand via maritime shipping.
*While not included in this analysis, crude oil was also carried into PADD 5 by sea: https://www.eia.gov/todayinenergy/detail.php?id=67964
**Calculated from Crude Oil (bbl) provided by VesselFinder
***Calculated by the authors from EIA data.
| Month-Year | PADD 5 Petroleum Product Consumption (Mbbl)1 | Inbound from PADDs 1-4, Pipeline, Rail, Tanker, and Barge (Mbbl)2 | PADD 3 to PADD 5 Movement, Tanker and Barge Only (Mbbl)3 | International Imports to PADD 5 (Mbbl)4 | % Share of PADD 5 Consumption from PADD 3 to PADD 5 Movement, Tanker and Barge Only5 |
|---|---|---|---|---|---|
| Jan-25 | 85,108 | 16,706 | 1,250 | 6,442 | 1.47% |
| Feb-25 | 75,364 | 14,783 | 590 | 6,954 | 0.78% |
| Mar-25 | 87,783 | 15,962 | 638 | 10,312 | 0.73% |
| Apr-25 | 88,318 | 16,086 | 1,247 | 11,917 | 1.41% |
| May-25 | 89,214 | 15,574 | 936 | 14,264 | 1.05% |
| Jun-25 | 89,071 | 16,710 | 1,453 | 11,422 | 1.63% |
| Jul-25 | 91,115 | 15,395 | 1,260 | 11,408 | 1.38% |
| Aug-25 | 89,561 | 14,713 | 1,104 | 9,352 | 1.23% |
| Sep-25 | 87,853 | 15,925 | 967 | 11,999 | 1.10% |
| Oct-25 | 89,096 | 16,389 | 1,243 | 14,937 | 1.40% |
| Nov-25 | 82,129 | 15,133 | 1,009 | 12,954 | 1.23% |
| Dec-25 | 82,775 | 17,624 | 1,130 | 9,751 | 1.37% |
| Jan-26 | 81,081 | 15,444 | 822 | 8,184 | 1.01% |
| Feb-26 | 75,096 | 14,465 | 736 | 9,200 | 0.98% |
| Mar-26 | 82,484 | 16,466 | 1,763 | 12,352 | 2.14% |
| Apr-26 | 84,993 | 17,921 | 4,649 | 13,576 | 5.47% |
| May-26 | 86,587 | 19,609 | 5,145 | 9,333 | 5.94% |
| Jun-26 | 87,428 | 22,196 | 6,992 | 7,968 | 8.00% |
| Jul-26 | 91,386 | 19,298 | 4,433 | 8,235 | 4.85% |
|
1 EIA states (https://www.eia.gov/todayinenergy/detail.php?id=63184) that its “Product Supplied” data set approximates, though is not identical to, consumption, which it does not track. https://www.eia.gov/dnav/pet/pet_cons_psup_dc_r50_mbbl_m.htm 2 https://www.eia.gov/dnav/pet/pet_move_ptb_a_EPP0_TNR_mbbl_m.htm 3 https://www.eia.gov/dnav/pet/hist/LeafHandler.ashx?n=PET&s=MPEMTP5P31&f=M 4 https://www.eia.gov/dnav/pet/hist/LeafHandler.ashx?n=PET&s=MTTIMP51&f=M 5 Calculated by the authors (=Column D/Column B) |
|||||